Group decision making is when two or more individuals must collectively choose among a competing set of alternatives based on their individual preferences. Such scenarios are ubiquitous in research and planning generally – from choosing a candidate for a position, to deciding which research projects are most important for future work – as well as in marine research and policy making specifically (for instance, in selecting locations for marine protected areas).
In these situations, it can be helpful for decision makers to model and visually compare stakeholder preferences in order to better understand others’ points of view (as well as their own, in some cases). Although a number of visualization tools for group preference modelling and inspection exist, none are based on a rigorously-obtained understanding of the needs of decision makers in general.
We are taking foundational steps in addressing this gap:
- We have examined a number of group decision scenarios from a wide range of problem domains in order to extract domain-independent insights into the needs of decision makers.
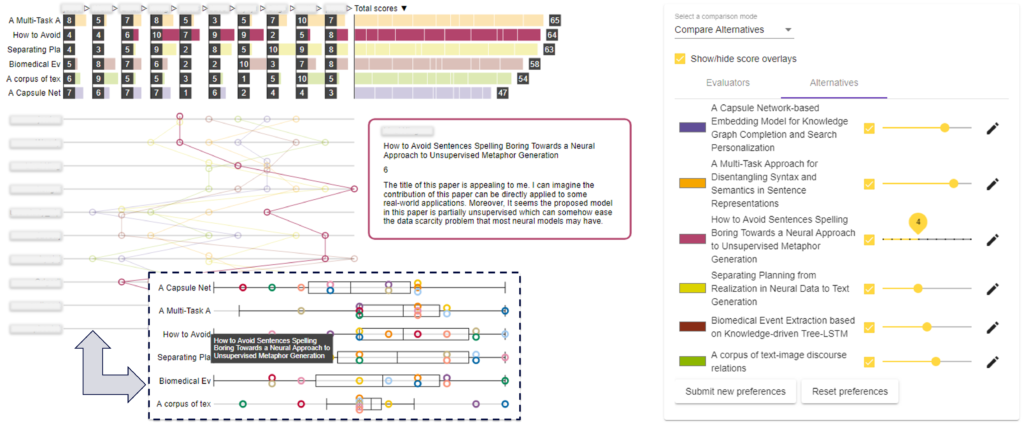
- Focusing on scenarios where stakeholders score alternatives directly, we have developed a prototype that allows stakeholders to submit preferences remotely and asynchronously, and it also allows them to update their own preferences while they inspect those of the group. A tool based on this prototype is nearing completion.
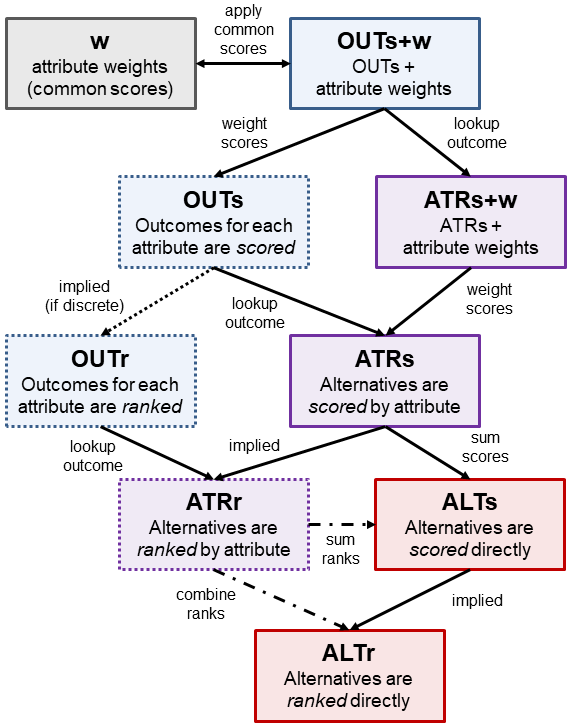
- We have developed data and task abstractions that span the space of possible preference models, whether the stakeholders are
- giving preferences in terms of ranks or scores
- applying those preferences to alternatives or to their attributes
- whether these attributes are subjectively or objectively assessed
- whether the attributes are of equal or different significance
- As part of this work, we have created a taxonomy of these preference models.
- We are also designing an improved preference visualization tool that can elicit and display preferences from any part of this preference model taxonomy. We plan to integrate these preference visualizations with spatial and data contexts to form a more complete group decision support tool.
- We are exploring the integration of natural language with these preference visualizations. Some preliminary work has already been done in terms of auto-generating captions for graphs with a data-driven neural approach.
References
Hindalong, E., Johnson, J., Carenini, G., & Munzner, T. (2020, June). Towards Rigorously Designed Preference Visualizations for Group Decision Making. In 2020 IEEE Pacific Visualization Symposium (PacificVis) (pp. 181-190). IEEE.
Spreafico, A., & Carenini, G. (2020). Neural Data-Driven Captioning of Time-Series Line Charts. In Proceedings of the 2020 International Conference on Advanced Visual Interfaces (to appear).