Data visualization provides an engaging and interactive way to closely examine different aspects of a dataset. MERIDIAN is currently working on several data visualization applications, and most prominently on the web-based interactive Atlas du paysage sonore sous-marin that will enable users to visualize and explore modeled underwater noise levels in a multitude of dimensions and obtain impact risk estimates in areas of interest.
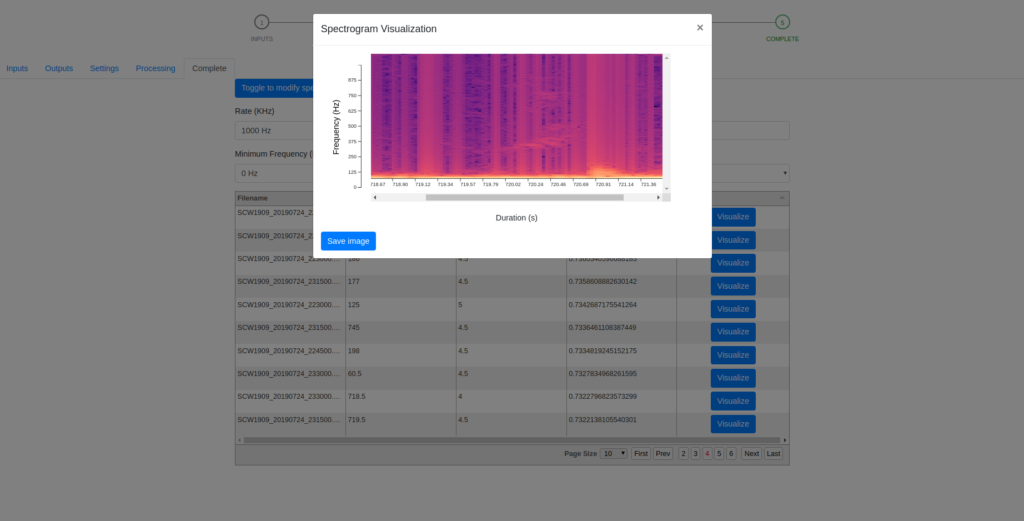
In addition to this, we are developing various smaller graphical applications such as specviz.js, a lightweight javascript plugin for visualizing spectrograms, and Kedgi, which is a graphical interface enabling you to run our deep learning algorithms in your favourite internet browser.
We are also collaborating with JASCO on developing a novel tool for visualizing directional acoustic data, which you can read more about here.
Finally, we are developing a decision making tool that helps groups of people choose among a competing set of alternatives based on their individual preferences, which you can learn more about here.
Our data visualization products aim at bridging the gap between researchers, decision makers and the general public, providing everyone with a user-friendly tool to increase their ocean literacy. For more information, explore the individual products and services listed in the menu to the right.